 Plate 01
Geometry on arrival, or pixels in advance
Send the shapes and let the client draw them, or send a picture already drawn. Everything else — performance, flexibility, fidelity — follows from that one decision.
Printed once, the drawing is fixed. Sent as geometry instead, it can be drawn differently for every reader.
Photo: Suzy Hazelwood / Pexels
What each approach actually delivers
A vector tile arrives as compressed geometry: coordinates, attribute values, a stylesheet to apply. The client — a browser, an app, a renderer — reads the shapes and draws them fresh at display time. That means the same data can be restyled without touching the server, labels can be placed to avoid collisions at the current viewport, and features can be queried by attribute the moment a user clicks. The geometry stays geometry until the very last moment.
A raster tile is already a picture. The server drew it — or a rendering pipeline did, ahead of any request — and the result was frozen as pixels. What arrives is an image, not a description. The client composites it onto the screen and has essentially no access to what is inside: no attributes to query, no lines to redraw in a different colour, no labels to reposition.
The contrast sounds like a clear win for vectors, and at a technical level it often is. But the constraints move with the choice, and some of them favour pixels.
Where pixels still earn their keep
Raster delivery is predictable in a way that vector delivery is not. A server can pre-render an entire zoom pyramid and then serve each tile from storage as a flat file, with no per-request computation and no client-side rendering load. A low-powered device — a fieldwork tablet on a poor connection, an embedded display in a vehicle — receives exactly what it will show. Rendering cost is paid once, at tile-generation time, and amortised across every subsequent request.
This matters especially for imagery. Satellite and aerial data is raster at its source: the sensor captures discrete values in a grid, and that grid travels to the screen as pixels. Reprojecting and serving it as a raster tile is a natural pipeline. Attempting to represent a photographic surface as vector geometry would be absurd.
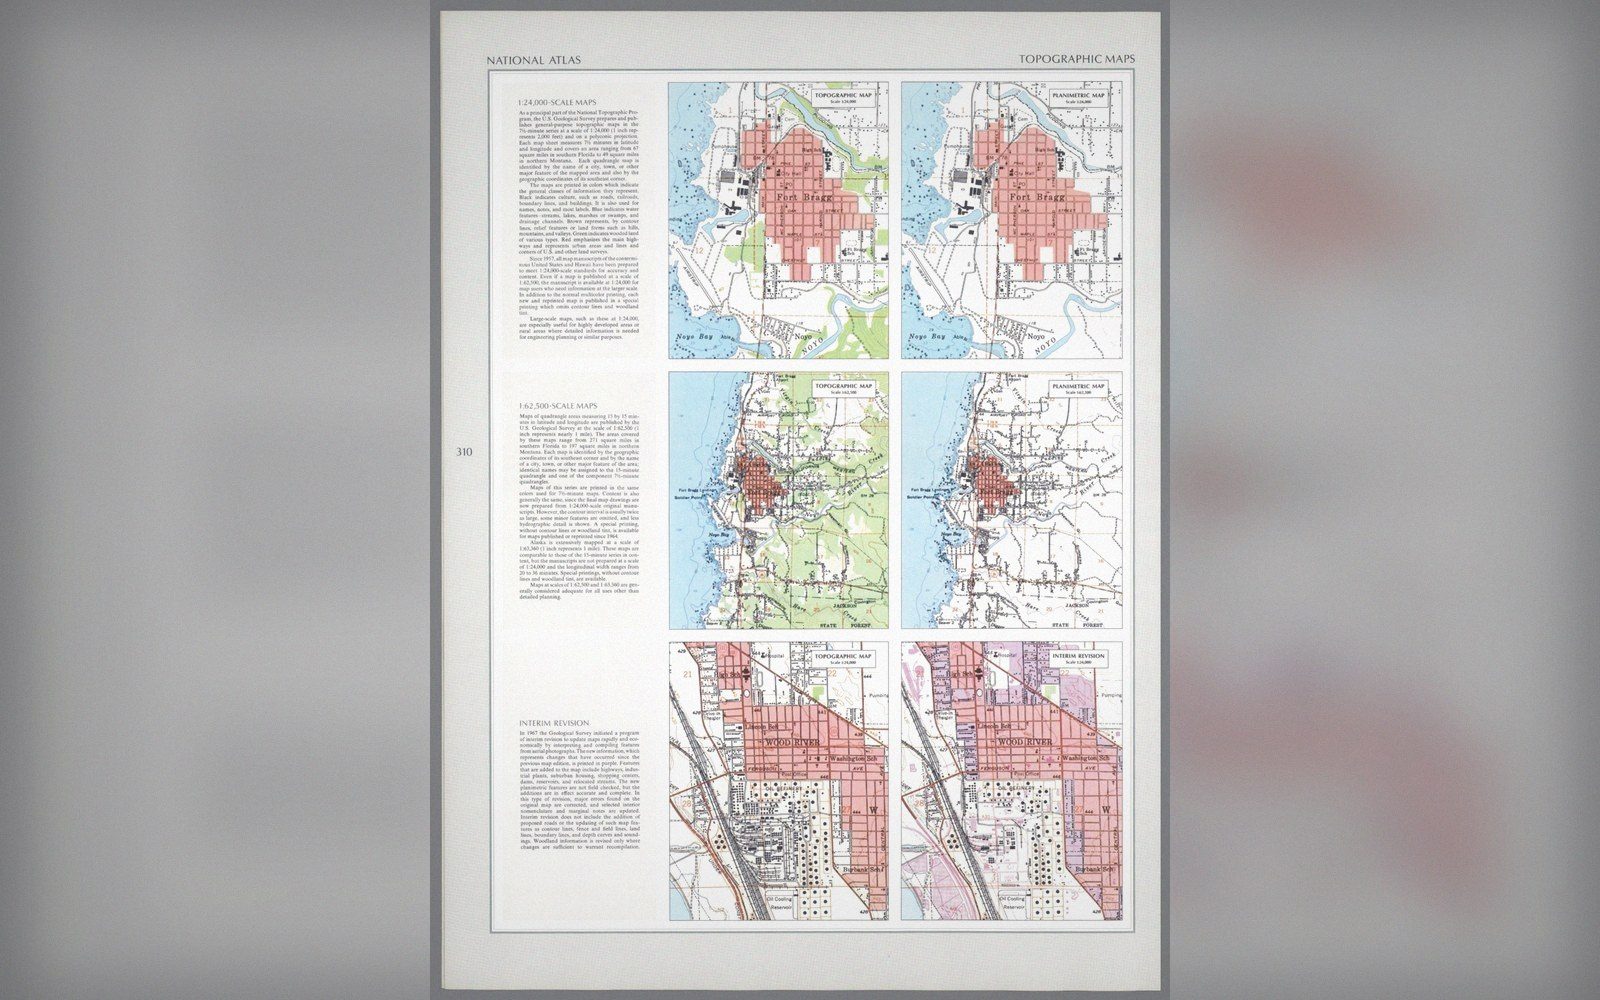 Plate 2
The same ground published twice, with contours and without. What a sheet leaves out is a decision about its purpose.
Photo: Topographic and planimetric sheets, Fort Bragg · Wikimedia Commons
Complex cartography can also favour pre-rendering. A richly styled topographic sheet — hill shading baked into the image, intricate line work, hand-adjusted label placement — may be far cheaper to serve as a finished picture than to reproduce those decisions in a client stylesheet at render time. The flexibility is sacrificed, but the look is guaranteed.
Where vectors create genuine difficulty is in seams, labels and edges: text that crosses a tile boundary must be handled carefully, or it splits. Raster tiles carry no such problem — the label was drawn into the image and the image edges align cleanly.
The decision moves the work, not the outcome
Choosing raster commits the cartographic decisions to the server pipeline. Colour, classification, line weight, label placement — all are fixed before the first request arrives. Changing the map means re-rendering. For a basemap that barely changes, this is fine; for a thematic layer whose data updates hourly, it is a serious constraint.
Choosing vector moves those decisions to the client and to the stylesheet. The same tile set can power a day mode and a night mode, a high-contrast accessibility version, a language-switched label set, all from identical geometry. The flexibility is real, but it has a cost: every client must run a rendering engine capable of consuming that geometry and applying the style faithfully. A capable browser on a fast machine handles this without strain; a constrained environment may not.

There is also the matter of data exposure. Vector tiles carry attributes — often every attribute in the source dataset — and a determined client can inspect them. If the underlying data is sensitive, serving pre-rendered rasters is the more conservative choice: the pixels reveal no more than what was drawn.
In practice, most web map stacks use both. A raster imagery layer sits underneath; vector geometry for roads, boundaries and labels overlays it, with client-side styling for the parts that need to flex. The division of labour is not ideological — it is a reading of which layer benefits from flexibility and which benefits from a frozen, cheap-to-serve picture.
The question to ask of each layer is not "which format is better?" but "when does this layer's information need to be resolved into pixels?" Answer that, and the rest of the architecture follows.
Also in Vector & Raster