 Plate 01
The length of a coastline
Measure with a shorter ruler, and it gets longer — without limit. A coastline has no single true length, only a length at a given scale.
A rugged, indented shoreline like this one offers more detail to measure at every smaller scale.
Photo: Coastline and rugged cliffs, Japan · DPLA / Wikimedia Commons
The Ruler Paradox
Walk the coast of Britain with a ruler one hundred kilometres long, and you will step across bays and peninsulas in broad sweeping chords. The result is a rough perimeter. Swap it for a ten-kilometre ruler and you pick up the Solent, the Wash, the Firth of Forth — inlets that the longer rule bridged in a single stride. Swap it again for a one-kilometre rule and you begin to trace estuary banks, harbour walls, and headland shoulders that the longer rod leapt clean over. Each time the ruler shortens, the measured length grows. This is not measurement error. It is the geometry of the coastline itself.
Lewis Fry Richardson noticed this in the mid-twentieth century when he compared official measurements of common land borders and found that different countries, using different cartographic scales, reported wildly different totals for the same boundary. The coast of Norway, deeply fjorded, grew far faster than the coast of South Africa as rulers shortened — its rugosity punished every reduction in step size more severely. Benoit Mandelbrot formalised the observation in 1967 and introduced the concept of fractal dimension to explain why the growth does not converge: a statistically self-similar curve — one that shows fresh complexity at every resolution — has no finite length in the limit.
The practical implication for mapmakers is immediate. When someone asks how long a coastline is, the honest first question is: at what scale was it measured?
What Scale Commits To
A dataset digitised at 1:250 000 records bends no smaller than the minimum feature size that scale can represent. A digitised harbour entrance, maybe three hundred metres wide, disappears entirely; the line drawn across the bay's mouth is shorter than the real shoreline that wraps inside it. Step the dataset down to 1:25 000 and the harbour entrance reappears, taking the measured length with it. The tolerance thresholds used during generalisation directly control which convolutions survive, and every convolution removed is length subtracted.
This is why national hydrographic and mapping agencies publish coastline lengths accompanied by a statement of scale or source resolution, and why figures drawn from different databases should never be combined into a single ranking without adjustment. Britain's Ordnance Survey, the United States Geological Survey, and Statistics Canada have each produced official coastline totals that differ from one another not because any of them measured wrongly, but because they measured at different scales with different generalisation tolerances. A comparison of "which country has the longest coastline" is, without declared scale, a comparison of which country used the finest ruler — Canada's rugged Arctic fjords and island labyrinths mean that finer measurement extends Canada's total by a disproportionate factor relative to a smoother coast.
 Plate 2
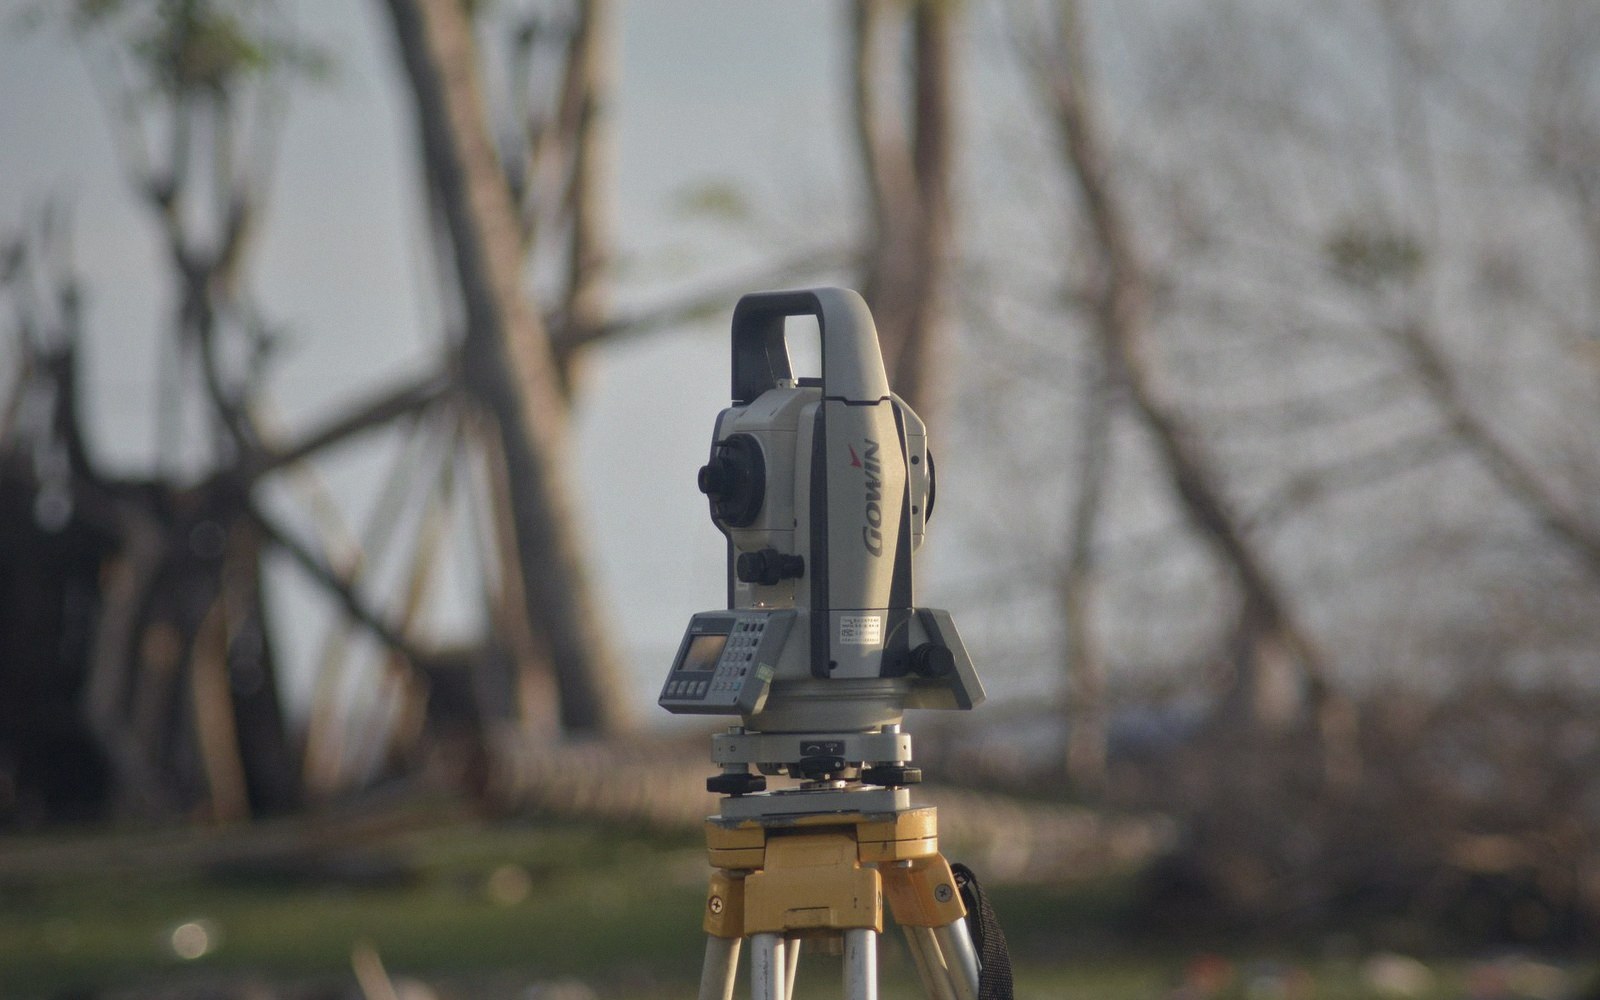
Line weight was a physical choice before it was a style rule — one nib, one width, and the hierarchy came from the set.
Photo: Thirdman / Pexels
The fractal dimension of the coastline is, in practical terms, an index of how severely length grows as resolution increases. A smooth, gently curved coast might have a dimension close to 1.0, barely more than a straight line. A deeply indented, rocky coast runs higher — closer to 1.2 or 1.3 — meaning measured length climbs steeply with each halving of step size. Richardson's original log-log plot of step size against measured perimeter reveals this as a straight line whose gradient encodes the dimension; a steeper gradient means more length waiting to be found at finer scales.
What a Map Can Honestly Report
A map that states a coastline length must commit to a scale. The stated figure belongs to the generalised representation, not to the physical world, and a legend or metadata note should say so. This matters for more than cartographic honesty: coastal planning, habitat area calculations, erosion-rate estimates and jurisdiction boundaries all depend on measurements derived from mapped data. A planning document that inherits a 1:1 000 000 coastline and uses it to calculate tidal wetland area will undercount systematically compared to one using 1:10 000 lidar-derived shorelines.
The deeper lesson is one about the nature of cartographic measurement in general. Scale is a commitment, not merely a display choice. The moment a mapmaker fixes a scale, every measurement derived from the map inherits that scale's omissions. Length, area, density — all are functions of what the generalisation kept. A coastline is only the most vivid demonstration of a principle that runs through every geometric measurement taken from a map: the answer depends on how you asked.
Also in Scale & Generalisation