 Plate 01
Resolution at the equator
Ground distance per pixel is quoted there and is smaller everywhere else.
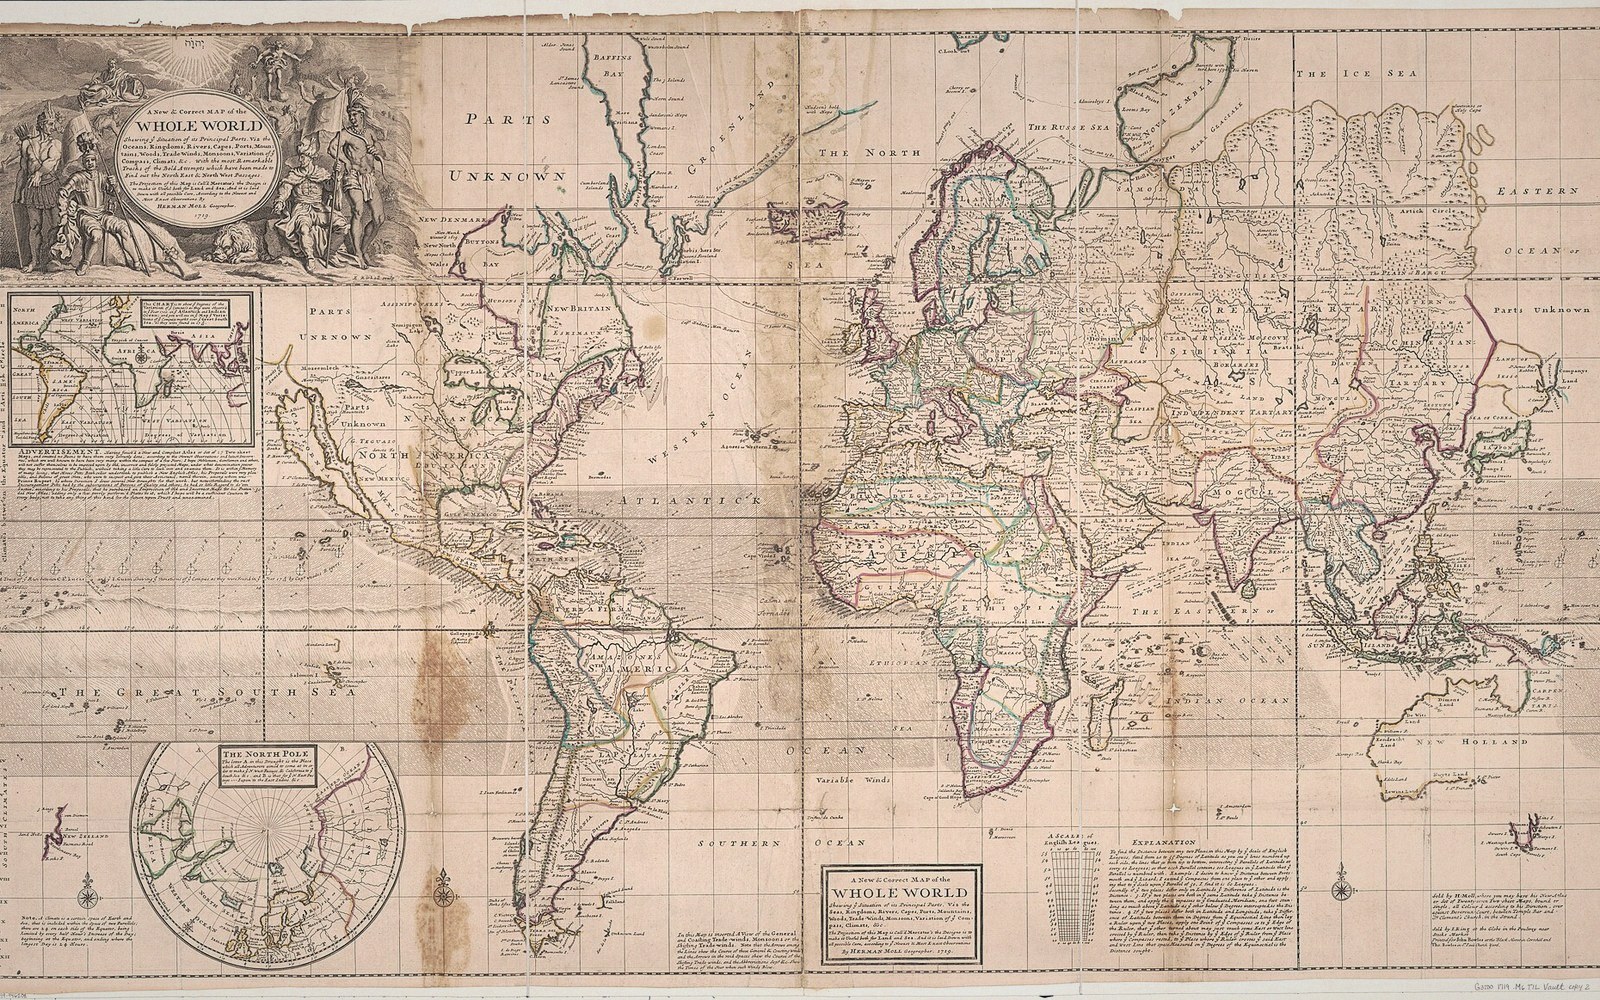
A world map with its scale bars along the margin. The figures hold where the projection touches the globe, and nowhere else.
Photo: Moll world map · Wikimedia Commons
The number everyone quotes is a local measurement
Every tile specification lists a ground resolution — so many metres per pixel at zoom level N — and the number cited is always measured at the equator. That is not a coincidence, and it is not arbitrary. It is a consequence of the projection underneath the whole tile pyramid.
Web maps are delivered in Web Mercator, a conformal cylindrical projection. The cylinder is tangent to the globe along the equator, which means the scale there is exact — or as close to exact as the spherical approximation allows. Everywhere else, Mercator expands. Features grow northward and southward, and the expansion accelerates: the higher the latitude, the greater the stretch. At 60° north, linear scale is roughly double what it is at the equator; at 70°, it is nearly triple.
 Plate 2
Every drawn grid is an agreement about where things sit — on tracing paper as much as on a screen.
Photo: Ksenia Chernaya / Pexels
Tile pixels are a fixed size on screen, but what each pixel represents on the ground changes with latitude. At zoom level 0 the single tile covering the whole world is 256 × 256 pixels; at the equator, each pixel corresponds to roughly 156 kilometres of ground. Take that same pixel to Oslo or Anchorage and the ground distance it covers is considerably smaller — the pixel has not shrunk, but the projection has already stretched the underlying geometry to fill it. The ground resolution figure is therefore a ceiling, not a representative average.
The three places this register keeps returning to, plotted at their true coordinates rather than sketched.
Drawn from the register’s own geometry — real coordinates, unprojected labels. Pins: Greenwich, Quito, Null Island.
This matters practically when you are deciding which zoom level suits your data. If your minimum mapping unit is, say, a 10-metre parcel boundary, you look up the zoom level at which Mercator's equatorial resolution crosses that threshold, and you use that level — but your parcels are probably not on the equator. At the latitude where your data actually sits, the effective resolution is finer, which means you may be able to work a level or two lower than the pyramid specification implies. The corollary is that any ground-distance label in tile documentation should be read as "this distance, at 0° latitude, nowhere else."
Specifications rarely state the caveat. The number is technically correct; it is just geographically specific, and treating it as universal is the kind of quiet assumption that shifts an analysis without announcing itself.
Also in Tiles & Zoom