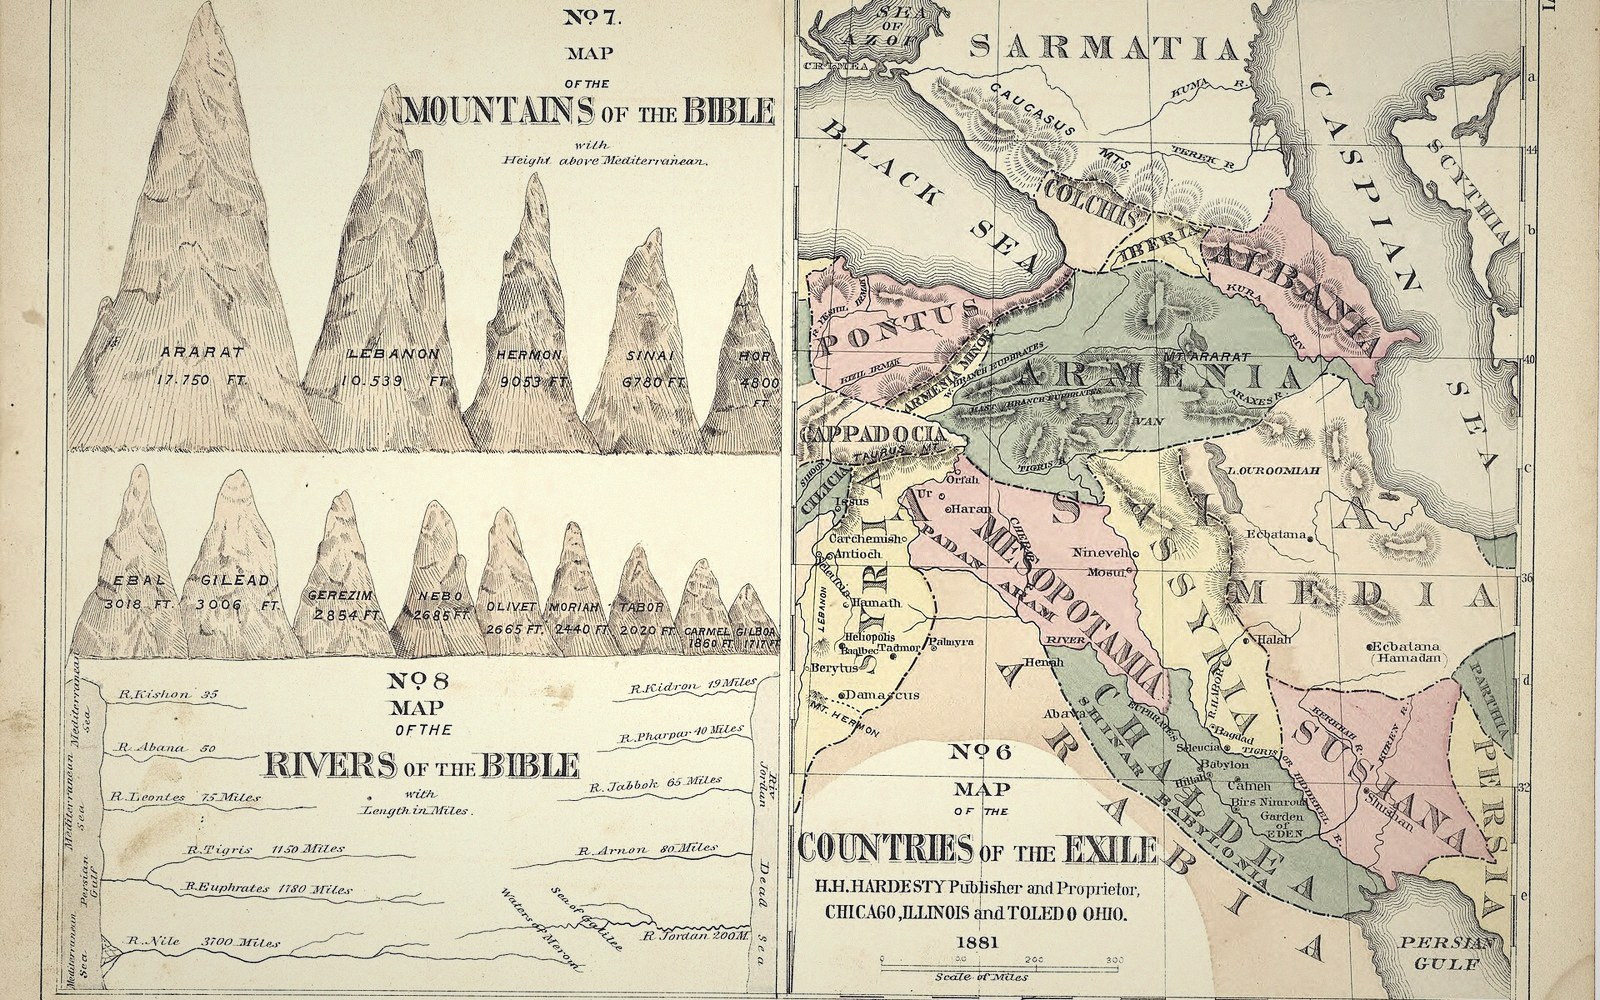
 Plate 01
One geometry, many scales
The same data cannot serve every zoom without being generalised for each.
An atlas plate drawn for one scale. The same geometry published at another scale is a different drawing, not a resized one.
Photo: Historical hand-atlas, large-scale copper plate maps · Wikimedia Commons
The data that doesn't travel well
A shoreline digitised at 1:10,000 contains hundreds of vertices per kilometre — every inlet, every rocky notch, faithfully captured. Zoom that geometry out to a continental overview and it still renders, but at enormous cost: thousands of coordinates resolving to sub-pixel distances, producing visual clutter the eye reads as noise. The data hasn't changed. The problem is that the original geometry was built for one scale and one scale only.
This is not a compression problem or a file-size problem. It's a representational one. A harbour wall that legitimately appears on a large-scale chart has no business appearing on a map of Europe — not because the wall is unimportant, but because at that extent it cannot be drawn truthfully. The symbol needed to mark it would be larger than the object itself. Generalisation, the deliberate reduction and reshaping of geometry for a target scale, exists precisely to resolve that conflict.
The practical consequence is that a dataset does not have one correct geometry; it has a family of appropriate geometries, one per scale band. Road centrelines simplified for a city plan look jagged and wrong at regional scale, where curves must be smoother and minor roads absent altogether. A country's administrative boundary that tracks every survey parcel at cadastral scale becomes, at world scale, a clean generalised line — and both versions are correct for their purpose.

Tiled web maps make the mismatch visible because they fix a discrete set of zoom levels and render each one independently. Serving the same source geometry at every zoom means either over-detailing the small scales or under-detailing the large ones. Properly built tile pyramids pair each zoom range with geometry that was generalised to match it — simplification tolerance set so that no removed vertex was ever visible at that resolution anyway.
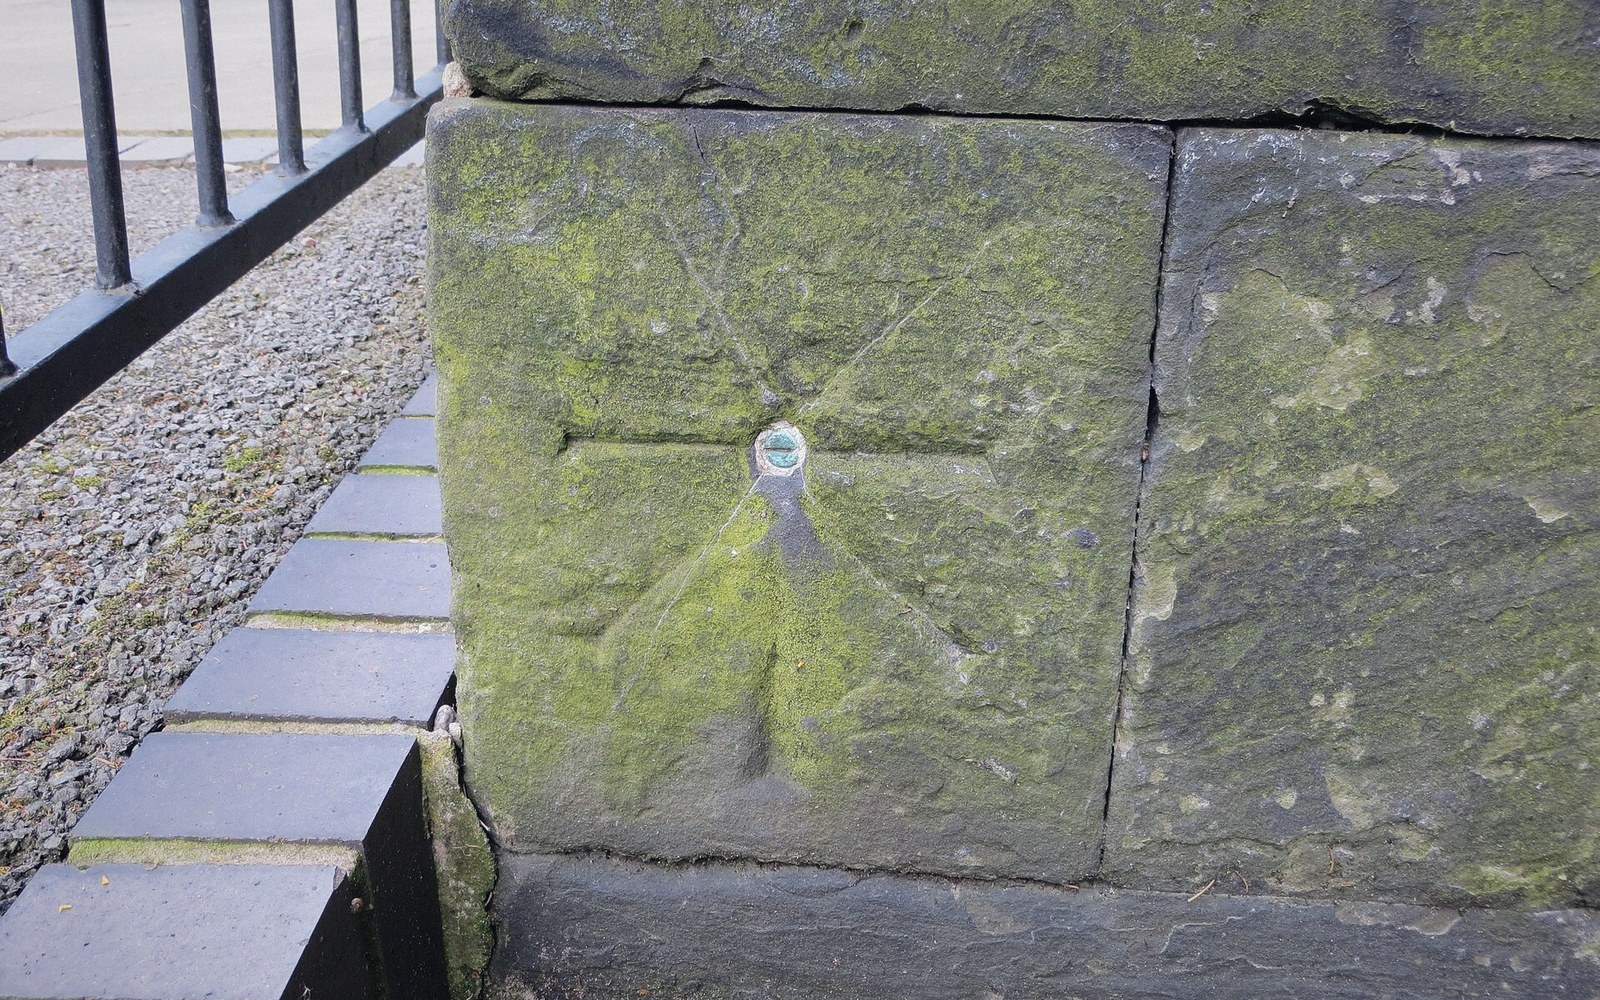 Plate 2
A cut mark fixes a height by agreement. Revise the agreement and every level surveyed from it moves with it.
Photo: Ordnance Survey cut mark with bolt · Wikimedia Commons
The cost of ignoring this is paid twice: once in rendering performance, and once in legibility. A map that carries too much geometry at small scale looks authoritative and is actually unreadable. The data you generalise away is not lost information; it is information that the scale had already made invisible.
Also in Scale & Generalisation