 Plate 01
Reading the indicatrix
Tissot's indicatrix turns abstract distortion into a thing you can see — but reading it correctly takes a moment's care.
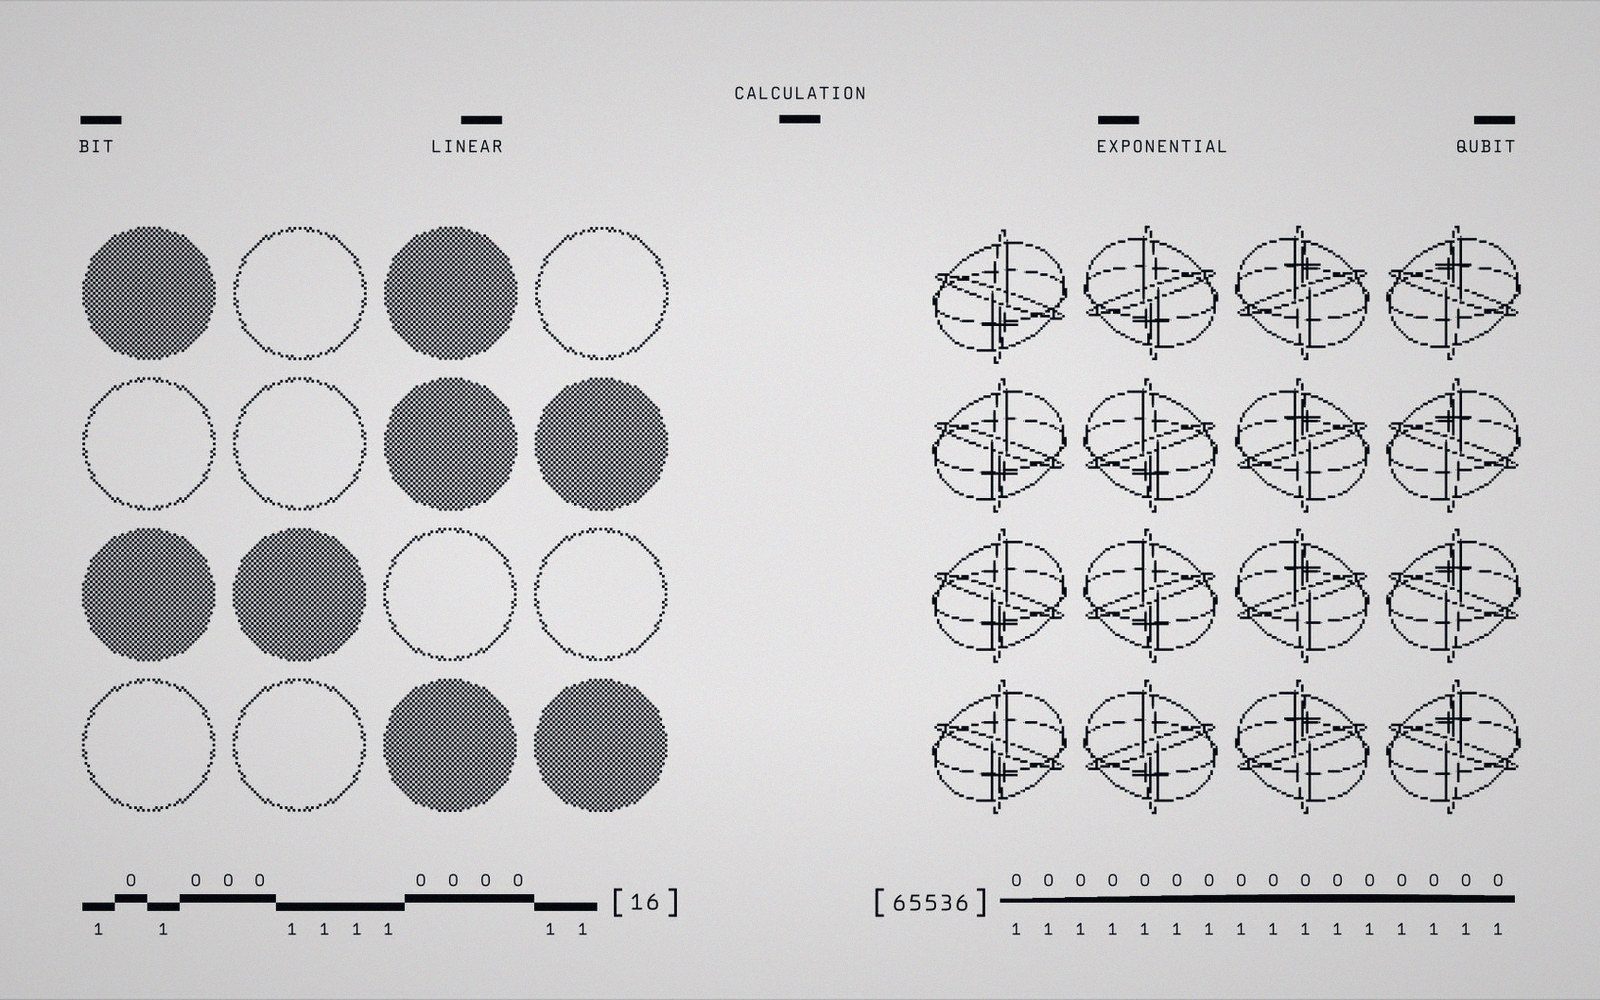
A field of circles drawn to be compared against each other — the device an indicatrix uses to report distortion at a point.
Photo: Google DeepMind / Pexels
What the circles actually show
Nicolas Auguste Tissot, a nineteenth-century French mathematician, devised an elegant diagnostic: draw infinitesimally small circles at regular intervals across the globe, then project them onto the flat sheet and observe what becomes of each one. Whatever shape they take, and however they vary from place to place, is precisely the distortion the projection introduces at that location. The indicatrix does not estimate or approximate; it is the distortion, rendered visible.
On the undistorted globe, every circle is identical — same radius, same area, same proportions. Project them and the transformation reveals itself. A circle that arrives as a circle has preserved local angles: the projection is conformal at that point. A circle that arrives as an ellipse whose area matches the original has preserved area. A circle that arrives as an ellipse that is neither the original area nor equant at the angles has introduced both kinds of distortion simultaneously, which is the general case for most projections at most locations.
The two axes of any resulting ellipse are meaningful. The longer axis points in the direction of maximum scale — where the projection has stretched most. The shorter axis points in the direction of minimum scale. When those two values are equal the ellipse collapses back into a circle, which is the signature of a conformal projection: it has not preserved area, but it has preserved the relationship between directions, which is what conformality means. When the two axes are unequal but the area of the ellipse matches the area of the original circle, you have an equal-area projection: shape is distorted, but nothing has been gained or lost in the accounting of surface.
Rotation, scale and the thing people miss
There is a detail that catches readers off guard. The indicatrix ellipse can also be rotated relative to its original orientation on the globe. Rotation encodes shear — the projection has not merely stretched or compressed, it has twisted the local coordinate frame. Many projections produce no shear along their standard lines or at their central meridian, but it appears off-axis, and a careful reading of the indicatrix orientation catches it.
Scale factor is encoded in the size of the ellipse as well as its shape. On a Mercator projection, the indicatrix circles near the equator are small and nearly circular (the scale factor there approaches one along the standard parallel), but toward the poles they balloon into enormous circles that remain circular in shape — the signature of conformality bought at the cost of severe areal exaggeration. On an equal-area cylindrical projection, the circles stay the same area but squash toward the poles into flat ellipses, their long axes pointing east–west, their short axes north–south. Neither projection preserves both things at once; the geometry of projection makes that impossible.
 Plate 2
Every drawn grid is an agreement about where things sit — on tracing paper as much as on a screen.
Photo: Ksenia Chernaya / Pexels
The practical discipline is to read all three properties together: shape of the ellipse (aspect ratio), size of the ellipse (area), and orientation. Shape alone tells you about conformality; size alone tells you about area preservation; orientation tells you about shear. Strip any one of those readings out and you misread the indicatrix.
Why mapmakers still reach for it
Modern cartography can compute distortion values numerically and shade them as a continuous surface. Yet the indicatrix grid survives because it is intuitive in a way that colour ramps are not. A glance at a world map covered in Tissot circles and you see immediately which regions the projection flatters and which it deforms. The circles cluster where distortion is low, bloat where it is high, and elongate where the projection is stretching in one direction more than another.
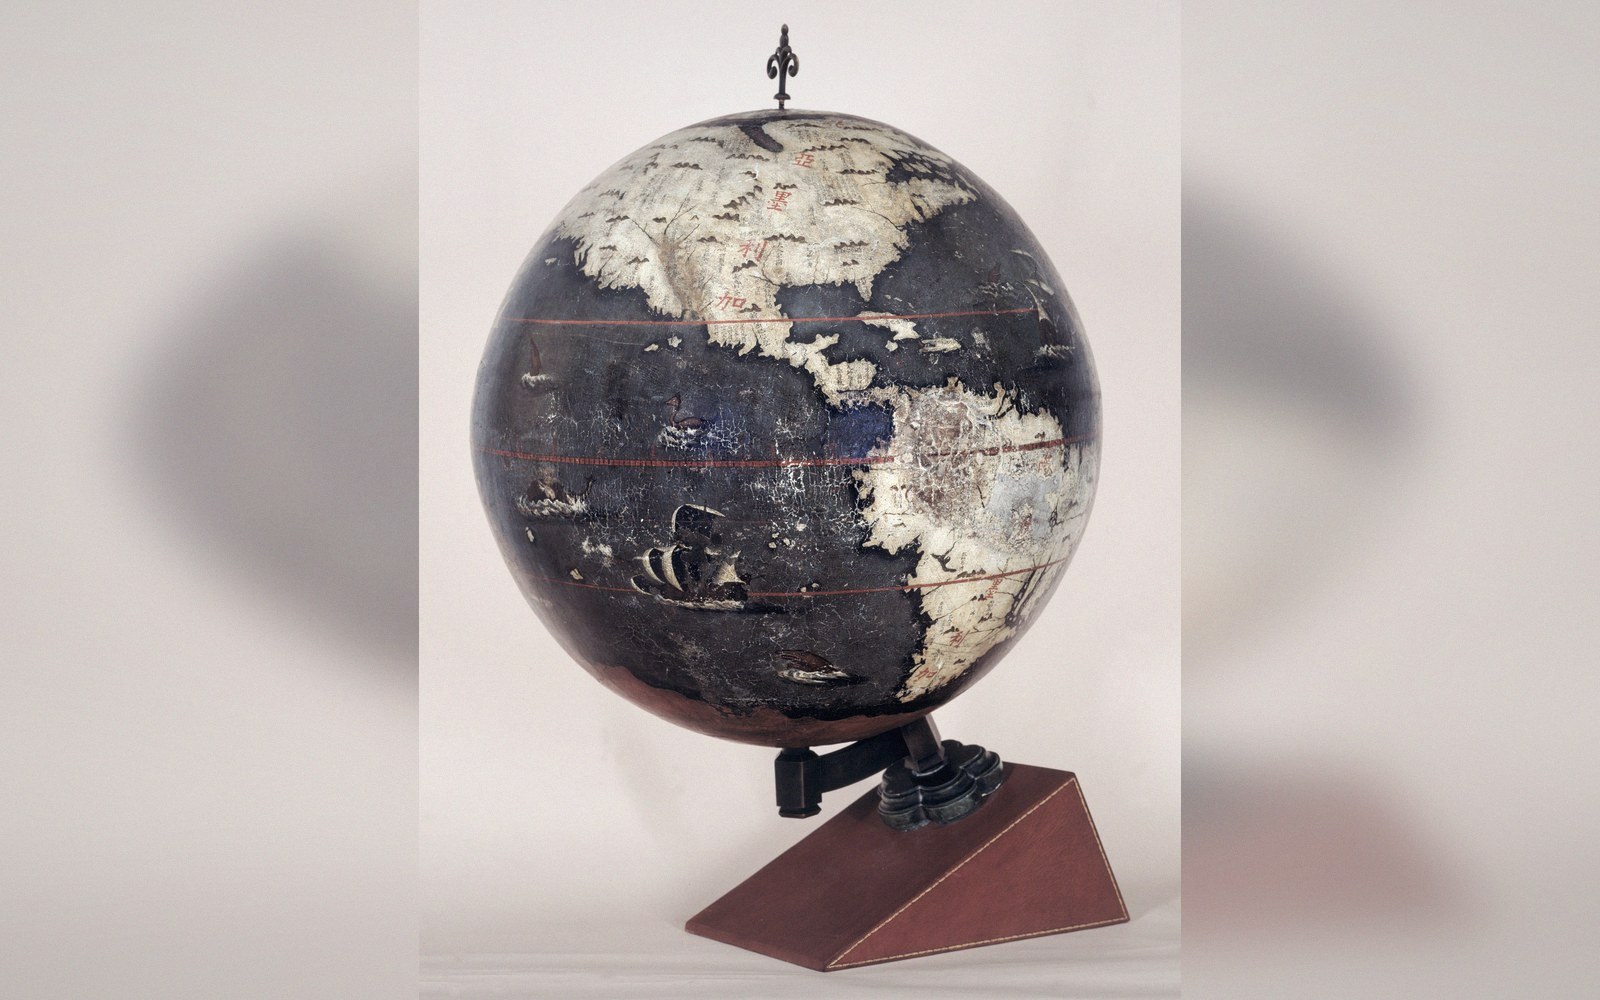
That directness is the point. When you are choosing a projection for a dataset — deciding whether angular fidelity or areal fidelity matters more, and where across the map surface either compromise becomes intolerable — the indicatrix shows you the answer at a glance. Numbers confirm what the ellipses already told you.
Also in Projections