 Plate 01
The pyramid, level by level
At the top, one tile covers the world. At the bottom, there are more tiles than a browser will ever request. What happens between the two extremes is the whole logic of web mapping.
Cells within cells: each level of the pyramid quarters the one above it, so almost every tile lives at the bottom.
Photo: Beyzanur K. / Pexels
The geometry of doubling
A tiled map is a pyramid, and the pyramid works by a single rule: every step down doubles the tile count in each direction. One tile at level zero becomes four at level one, sixteen at level two, sixty-four at level three. The progression is geometric — level n holds 4ⁿ tiles — so the numbers accelerate quickly. Level eight has around sixty-five thousand tiles. Level fourteen has more than two hundred and sixty million. By level twenty, the tally is in the trillions, though most of those tiles are ocean or empty land that a renderer will never bother to generate.
The tile size stays constant throughout: conventionally 256 × 256 pixels, more recently 512 × 512 on high-density displays. What changes is the ground area each tile covers. Add one zoom level, and the ground distance per pixel halves — or, more precisely, each tile's area quarters. This is why a city that appears as a vague cluster of pixels at level ten fills dozens of tiles at level sixteen. The pyramid is not scaling a single image; it is a sequence of independently rendered datasets, each appropriate to its own register of detail.
What each level is actually for
Practitioners have developed loose conventions about which zoom levels suit which geographic register. Level zero and one are barely useful — the whole world compressed to one or four tiles at 256 pixels carries almost no legible information beyond continental outlines. Level three or four is where political geography becomes readable: countries, major seas, the rough shape of mountain ranges. Street-level navigation typically begins around level fifteen or sixteen, where individual blocks and buildings become distinct.
These conventions matter for data preparation because the geometry you publish at level eight should not be the same geometry you publish at level fifteen. One geometry, many scales — serving unsimplified building footprints at a continental zoom is not merely wasteful; the renderer will draw shapes smaller than a pixel, the file size balloons, and nothing the reader sees improves. Each band of zoom levels needs data generalised to match. The pyramid is as much a schema for managing data resolution as it is a delivery mechanism.
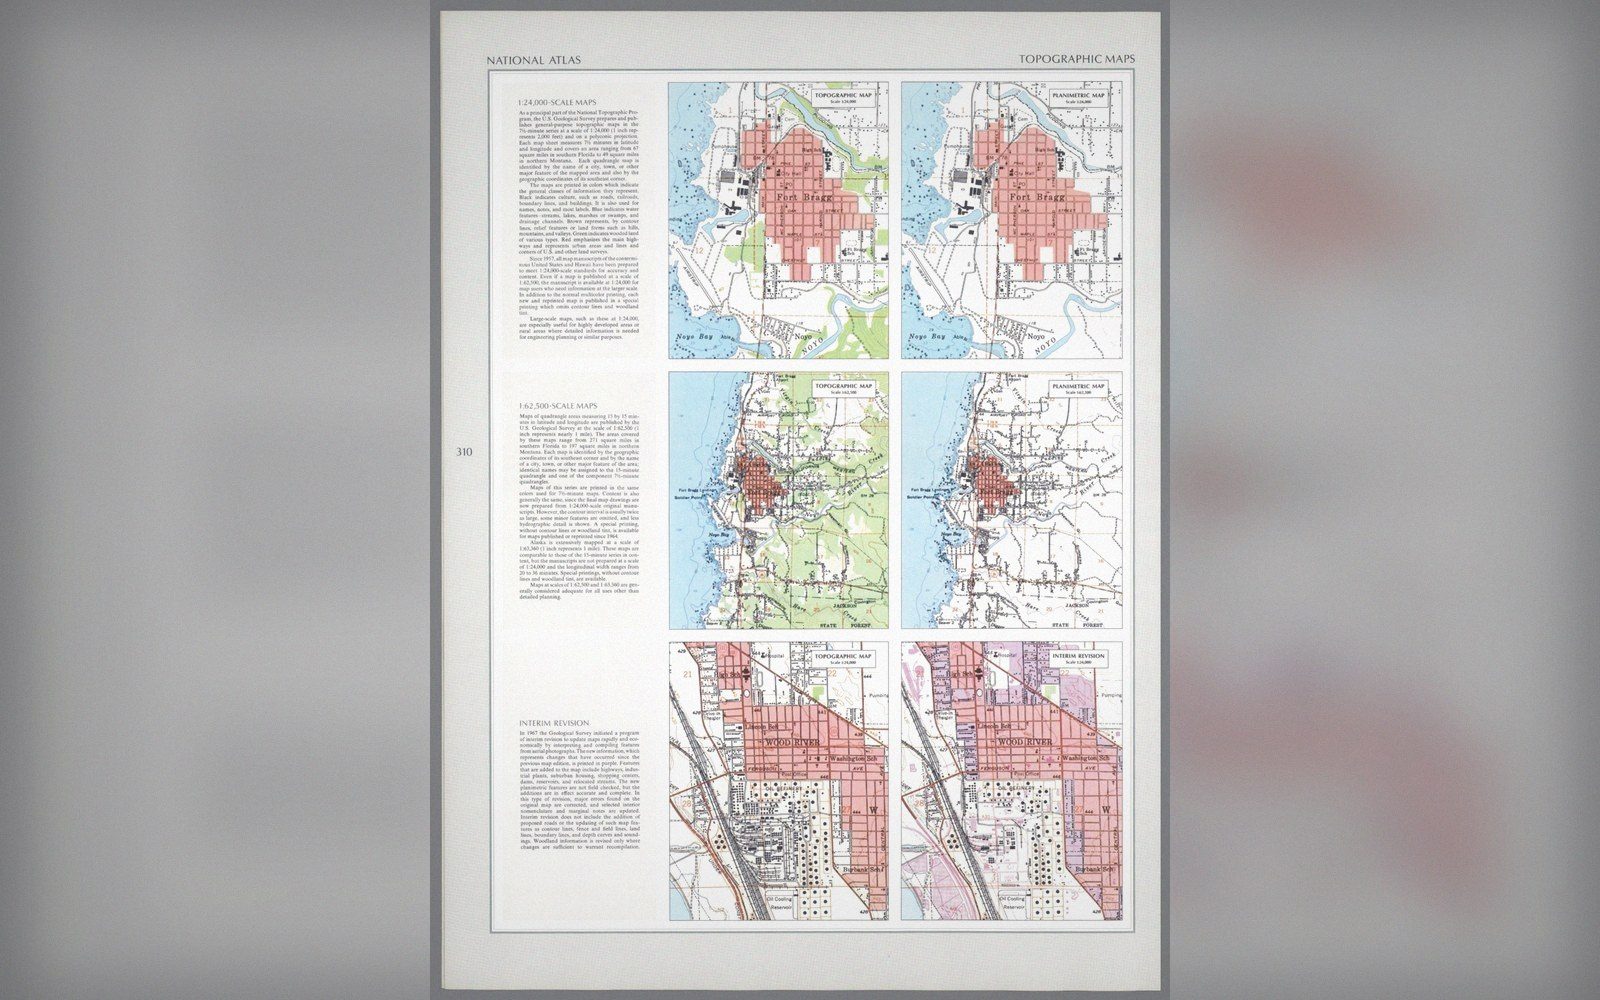 Plate 2
The same ground published twice, with contours and without. What a sheet leaves out is a decision about its purpose.
Photo: Topographic and planimetric sheets, Fort Bragg · Wikimedia Commons
The cost of going deep
Tile pyramids are asymmetric in an important way: almost all the tiles live near the bottom. Because each level quadruples the count, the top half of a twenty-level pyramid contains a negligible fraction of the total tiles. Storage and rendering effort concentrate at high zoom levels. For a commercial tileset covering a large country at full detail, generating and caching the deepest levels can account for the great majority of the total tile budget.
This asymmetry drives practical decisions about how deep to go. Many tilesets stop pre-generating at level fourteen or fifteen and rely on on-the-fly rendering for deeper requests, accepting a small latency penalty in exchange for not committing storage to tiles most users will never request. Others generate selectively — pre-caching densely populated regions at depth while leaving rural areas to render on demand. The pyramid's mathematics make both strategies legible: you can reason precisely about how many tiles occupy any geographic bounding box at any zoom level, and therefore about what selective caching actually costs.

Coordinates inside the pyramid
Every tile is addressed by three integers: zoom level, column, and row. The column and row count from a corner — typically the top-left in the most common XYZ scheme — and both reset to zero at the next level up. A tile at level five, column three, row seven does not cover the same ground as column three, row seven at level six; the same numbers point to a different place at each level. This is worth holding clearly in mind when stitching data across levels, though the grids do nest in a predictable way: the four children of a tile sit at double its column and row, plus zero or one, and together cover exactly the area of their parent.
The pyramid, taken whole, is a compact solution to an awkward problem: how to serve geographic detail that spans many orders of magnitude with predictable, cacheable responses. The four-to-one rule does all the work.
Also in Tiles & Zoom